Rethinking ITSM analytics for the AI-native era: Frameworks and use cases


Every ITSM tool ships with analytics. You've seen them: pie charts for ticket categories, bar charts for workload, volume trends over time. Deflection rate. MTTR. ESAT.
They all answer one question reasonably well: Is the system alive?
But when you’re running an IT (or HR, or Finance) service org day-to-day, the questions you need answered are more practical:
- What are people actually talking about? Not which category they picked from a dropdown, but what problems they’re trying to solve.
- Am I handling 80% of that volume well? Through deflection and automation, is my AI assistant actually resolving the bulk of requests?
- Is my team set up to handle the remaining 20%? For the requests that genuinely need human attention, are they getting to the right people quickly?
Most analytics can't answer these. Not because the data isn't there, but because of how it's structured.
I sat down with Gautham Menon, our Product Manager leading Atomicwork’s AI charter, to talk about how this gap drove us to rethink what our Insights report should actually do.
Service teams weren’t built for automation
Here’s an underappreciated truth we’ve learned working with enterprises of all sizes:
Most service teams were never designed with automation in mind.
They were staffed for ticket volume, not for identifying what shouldn’t become a ticket in the first place. They built processes to handle inflow — not to continuously eliminate it. Automation is a muscle most organizations are building for the first time.
So, when an admin wants to improve things, their question usually isn't “Can we automate?” It’s “What should I automate?”
Why bolt-on AI analytics don’t help
When you bolt an AI assistant onto an existing service desk, you typically end up with two separate analytics views:
- One for the Assistant: usage, deflection rate, popular questions.
- One for tickets: SLAs, resolution times, team performance.
They don’t talk to each other.
So when someone asks "How are we handling VPN issues?", you have to mentally stitch together the Assistant data (how many VPN conversations happened, what percentage was deflected) with the ticket data (how many VPN tickets were created, who handled them, were SLAs met).
You end up running the numbers in a spreadsheet, trying to connect dots your tools should be connecting for you.
Mapping the complete conversational journey
Employees don’t experience your service org in layers; they experience it as one journey. Your analytics need to reflect that.
Instead of treating conversations and tickets as separate data sets, we model the entire lifecycle of a request. A conversation with Atom might surface knowledge articles, present catalog options, and eventually create a ticket that gets routed, reassigned, and resolved.
That’s not multiple reports. That's one story. And we analyze it as such.
So when you look at "VPN connection issues", you should see:
- Total conversations about the theme
- What percentage were deflected, and which knowledge articles helped
- How many became tickets
- Time to first assignment
- Reassignment rates
- SLA performance
All in one view. All for that specific issue. But unified data is just the foundation. What matters is what kind of questions you can now ask.
Bringing a qualitative lens to your metrics
Traditional quantitative dashboards are great for pulse checks and quarterly business reviews. Is the AI agent being used? Is adoption going up quarter-over-quarter? They tell leadership whether the investment in AI is paying off.
But they're the wrong tool for the IT admin who's trying to figure out what to improve this week.
They don't need to know that deflection went from 62% to 64% last month. They need to know:
- Which issues are spiking
- Which request types aren't being handled well
- Whether the issue is missing knowledge, confusing catalogs, or broken routing
- Where workflows are breaking
- Where tickets are bouncing between teams causing delays and rework
That's qualitative insight. We made a deliberate decision to build Insights around this; not as an afterthought, but as the core.
How AI-native Insights works
Atom reads what people are saying across every conversation and request. Using Claude's language models, it then clusters similar issues together and organizes them into themes and sub-themes, ranked by volume.
As Gautham put it in the webinar:
“The inside joke is that Atom is a forward deployed analyst — always on, analyzing every request and every conversation 24/7. Except it’s an AI agent doing it behind the scenes."
The themes you see aren't predefined categories configured months ago. They're generated by analyzing how people describe their problems and how those conversations unfold.
This matters because real problems don't fit neatly into the category structures we set up months or years ago. "VPN issues" might break down into certificate problems, multi-client authentication failures, and connectivity on specific networks. Insights surfaces those sub-themes automatically, so you’re always looking at what matters most.
Once you drill into a sub-theme, Insights shows you a focused set of signals designed to answer a simple question: what should I fix or automate next?
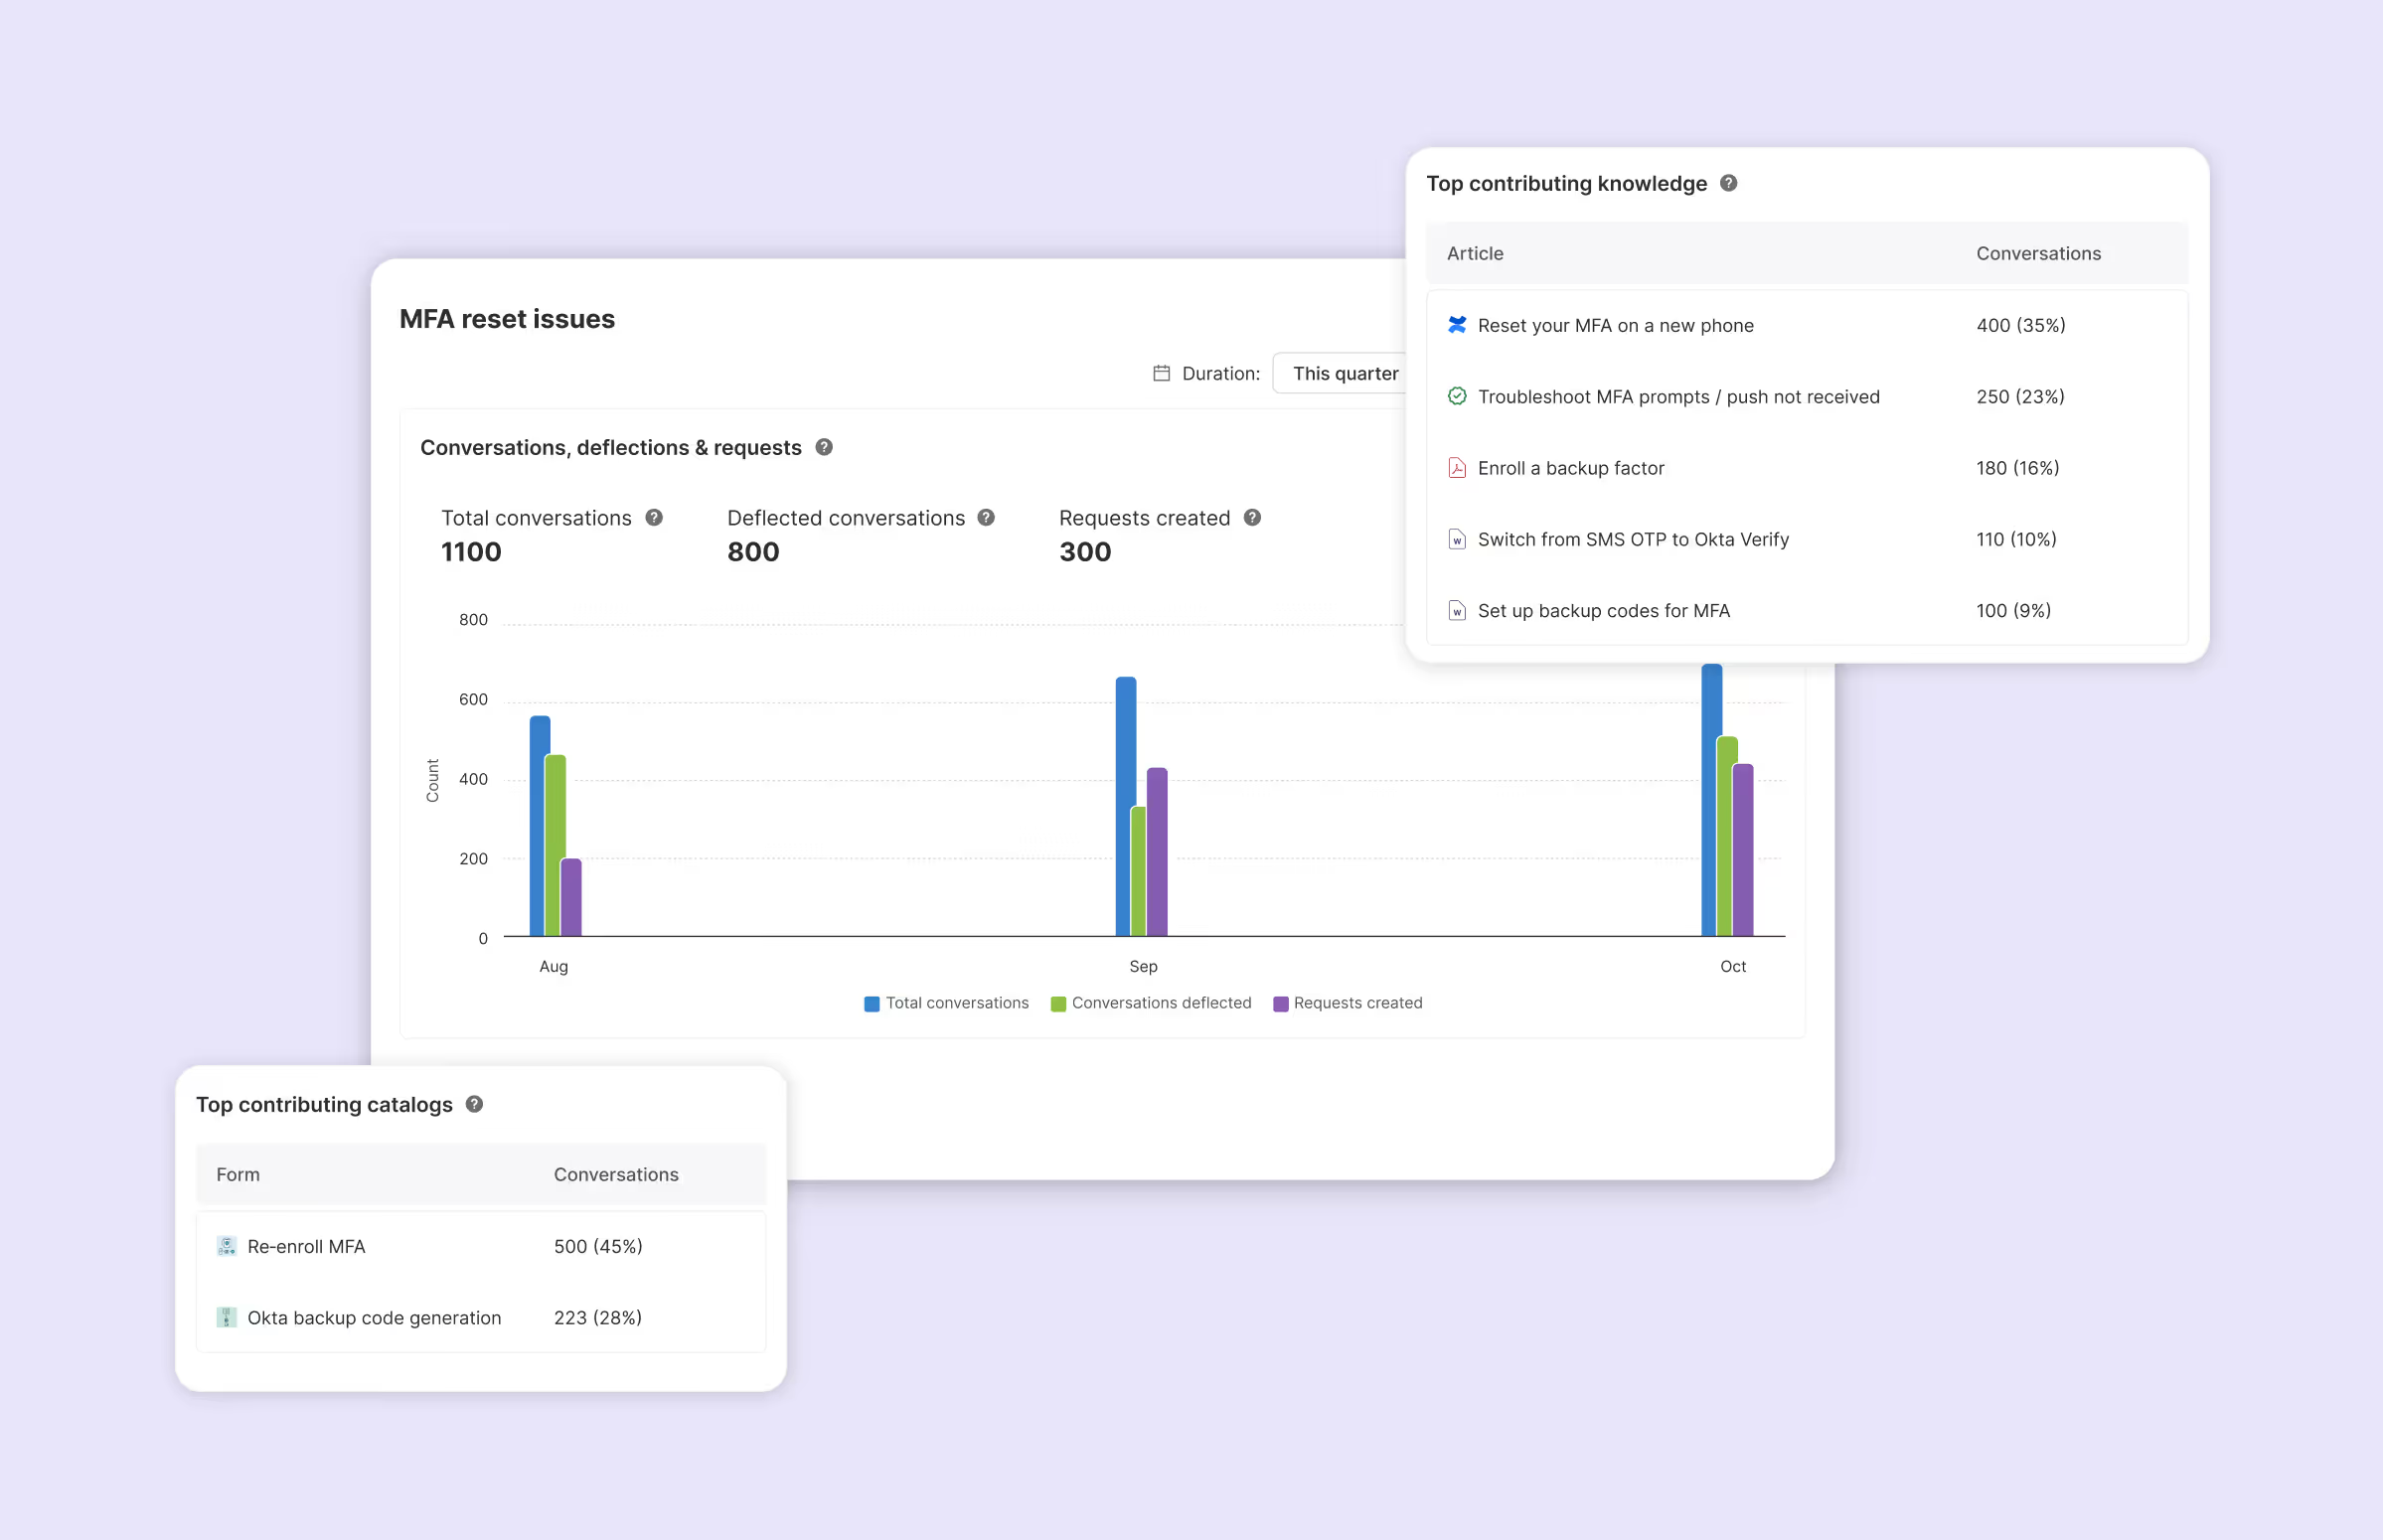
Volume: Conversations and requests, together
For every sub-theme, you see the total conversations and total requests created, across all channels.
Not every problem starts in a chat. By pulling all entry points into one view, Insights shows the true demand signal, not just conversational traffic. It helps you answer: is this really high-volume or are employees bypassing the Assistant entirely?
Deflection, knowledge, and catalogs
You also see:
- What percentage of conversations were actually deflected
- Which knowledge sources contributed to that deflection
- Which service or incident catalogs were surfaced to the user
You understand whether it's a knowledge problem, whether the issue simply can't be resolved with information alone, or whether users are being overwhelmed with choices that lead to incorrect routing downstream.
Request handling metrics
You also see request metrics like:
- Time to first assignment
- Reassignment rate
- Time to resolution
- SLA performance
These show how efficiently requests are handled once they reach a human. They reveal where ownership is unclear, where tickets bounce between teams, where certain problem types consistently breach SLAs and need different routing or staffing.
What this looks like in practice
Scenario 1: You're seeing high reassignment rates.
In a traditional ITSM dashboard, you'd see "average reassignments per ticket" as an org-wide metric. Maybe you can filter by team. But you don't know which problems are causing the ping-pong.
In Insights: Reassignment rates per theme.
You discover that VPN-related tickets have an 88% reassignment rate, averaging 2 reassignments each. Meanwhile, hardware requests are fine.
Now you have a clear next step: Fix routing for VPN issues. Create a dedicated incident catalog with clear assignment rules. The problem is scoped, not buried in an average.
Scenario 2: You want to improve deflection.
Traditional view: "Deflection rate is 65%. Goal is 75%."
In Insights: Top 10 themes by volume.
For “Network Connectivity,” the deflection is 71%. Application Access is 48%.
Within Application Access, the sub-theme "SSO Authentication" has almost no deflection - Atom surfaces articles but users still create tickets.
You now know SSO authentication needs better knowledge content, or a workflow that actually resolves the issue instead of just explaining it.
Scenario 3: You need to manage catalog sprawl.
Service desks accumulate catalogs over years. Mergers, team changes, new tools – every process change adds to the existing sprawl. Eventually you have six different ways to report a VPN problem.
Insights shows which catalogs are being surfaced for each theme. If "General IT Request," "Network Issue," "VPN Troubleshooting," and "Zscaler VPN Issues" all appear for the same sub-theme, that's a signal. Users (and Atom) are confused. Time to consolidate.
What’s next
The current Insights report answers "what's happening". The next phase is "what should I do about it."
We're working on surfacing specific recommendations:
- Catalog hygiene: Identify which catalogs to merge, simplify, or retire so requests route correctly and users stop guessing.
- Knowledge hygiene: See which content actually resolves issues, where gaps or conflicts hurt deflection. Your knowledge base should improve outcomes, not just coverage.
- Automation gaps: Spot high-volume issues that still rely on manual handling, where adding the right workflow will have an outsized impact.
The goal: Close the loop. Not just show you data but tell you the three things to do this week to make Atom smarter, without turning your job into full-time forensics.
The ROI question
We do get asked about ROI constantly. It's important, but it's a different question than what Insights is designed to answer.
ROI is an output metric. You measure it quarterly or annually. It tells you whether the investment was worth it.
Insights focus on the input metrics that drive ROI. Fix your reassignment problems, improve deflection for your top five themes, clean up your catalog structure and ROI will follow.
Building for the AI-Native Era
Traditional ITSM analytics were designed for a world where humans handled most requests, and AI was a bolt-on. The data models reflect that: tickets are the primary object, conversations are a separate add-on.
We built Atomicwork differently. Conversations are first-class objects. Every interaction is tracked and linked - to its knowledge sources, to any tickets created, to the catalogs surfaced. This is what makes Atomicwork Insights possible. It's also what makes this kind of analysis impossible to retrofit onto legacy platforms.
If you’d like to see Insights in action or talk through what qualitative ops intelligence could look like for your team, reach out to us for a demo.